Power Station Analytics: Algorithm Suite Delivered
100%
Algorithms tested99%
Boundary case accuracy40%
Faster incident recovery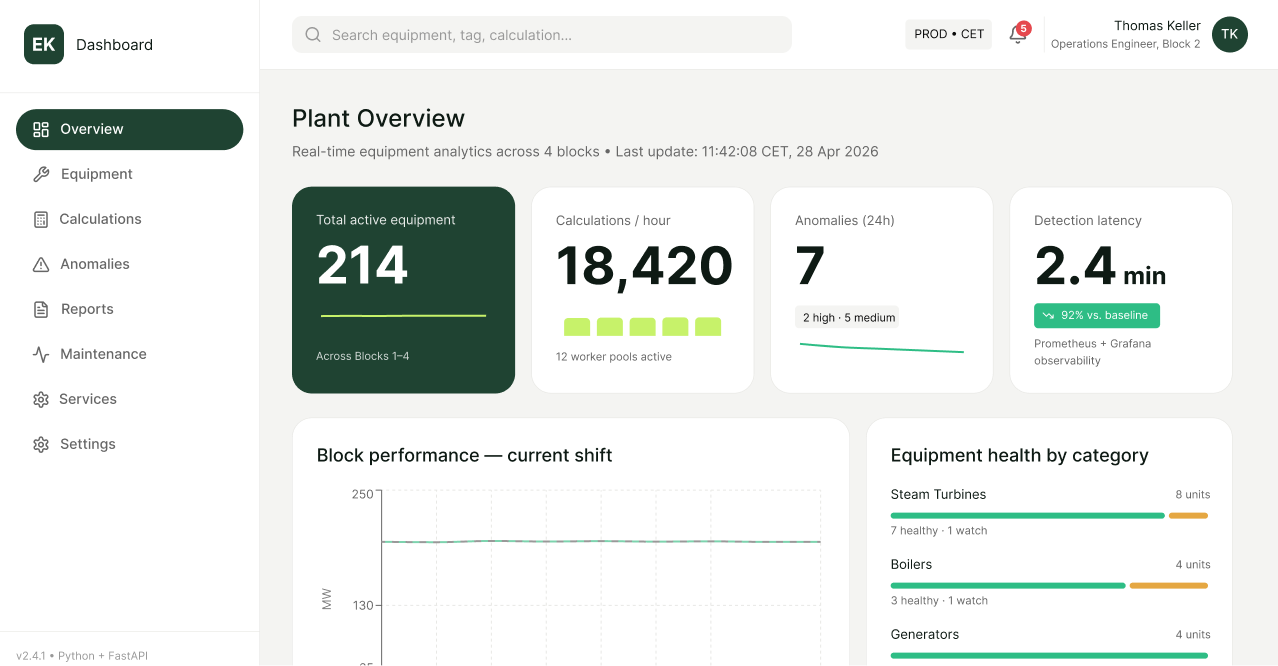
Client Overview

Business Problem
Situation Before
Core Pain
Risks
- Undetected equipment degradation in a power station carries significant operational and safety risk.
- Manual analysis added latency to spotting developing issues, so problems could grow before anyone noticed.
Constraints
- The client's engineering team locked the stack: Python with FastAPI, Celery and PostgreSQL.
- The algorithms were designed by a separate domain team, so their domain logic had to be followed carefully in code.
- The system was set up with Docker and deployed on the client's own infrastructure.
Project Goals
- Deliver an operational analytics platform executing domain-specified calculation algorithms on equipment telemetry data
- Ensure calculation accuracy through automated testing
- Support future algorithm changes without architectural rework
- Develop a platform with a fully accurate implementation of the given algorithms
- Achieve 90% unit test coverage, with all paths through critical processes covered by end-to-end tests
- Ensure platform modularity to support future changes
- All specified algorithms implemented and validated against domain team requirements
- Automated tests covering all critical calculation logic ensuring reliability and regression safety
- Platform fully operational in production with end-to-end monitoring and observability in place using Prometheus and Grafana
Solution
Four distinct services were created on this platform, each responsible for a different calculation area. Three Celery workers operated in each of these services on different priority levels in order to have the calculations carried out efficiently and concurrently. The PostgreSQL database provided persistent storage for the data, while Redis acted as the task broker and caching mechanism. Metrics from each service were collected by Prometheus and monitored using Grafana dashboards. This kept each calculation area independent and easy to reason about.
Calculation algorithms for the specific domain were coded in Python, and a normalization algorithm was extended and refined. Automated tests were developed for all of the calculation logic. Celery worker priorities were set so the most important calculations ran first. In terms of monitoring, Prometheus exporters were integrated, along with Grafana dashboards. Together, these covered the full path from algorithm implementation to tested and observable calculations in production.
All services were containerized by using Docker in order to maintain consistency between all environments. Metrics were gathered for every individual service by using Prometheus, while operational dashboards were created by means of Grafana. The platform was deployed on the client’s own infrastructure, as opposed to being deployed in the public cloud. This setup kept the whole system reproducible and under the client's direct control.
The data integrity was guaranteed by ensuring that the input values were checked for their validity prior to running the calculations to prevent malformed input data from reaching the algorithm. The tests covered the edge cases in the numerical calculation logic to catch the silent errors that would go unnoticed otherwise. In a critical application in a power station, it was just as important to catch these errors as it was the outcome of the algorithm. Together, these checks protected the accuracy of every calculation the platform produced.
Key Steps
In the first three months the team built the first two of the four calculation services, each covering a specific area of equipment analysis, along with their automated tests. This delivered the first working calculations and set the testing pattern for the rest of the platform.
From months four to six the team built the algorithm extension functionality and delivered the other two of the four calculation services. This widened the calculation coverage and brought the refined normalization algorithm into the platform.
In the final two months the team integrated the services, set up monitoring, stabilized the platform and handed it over. By the end, all four services were running in production with dashboards in place.

Results & Impact
Project Snapshot
See Other Works
Secure LLM Gateway for a 63,000-Person Enterprise
Secure enterprise AI access with centralized governance, lower latency, content controls, and full token usage visibility
Bond Settlement Cut from 2 Days to 30 Minutes
End-to-end capital markets platform automating bond issuance, trading, settlement, and investor servicing
API Response Time Down 80% for a Bloomberg Rival
Financial analytics platform delivering real-time market data, news processing, and scalable backend services for fintech